Website uptime tells you when something has already broken. Server resource monitoring lets you see the problem coming — the disk that's 95% full, the memory leak creeping up, the CPU pinned at 100% — and fix it before it takes the site down. Here's how server monitoring works in Monitorix.
What resources does Monitorix track?
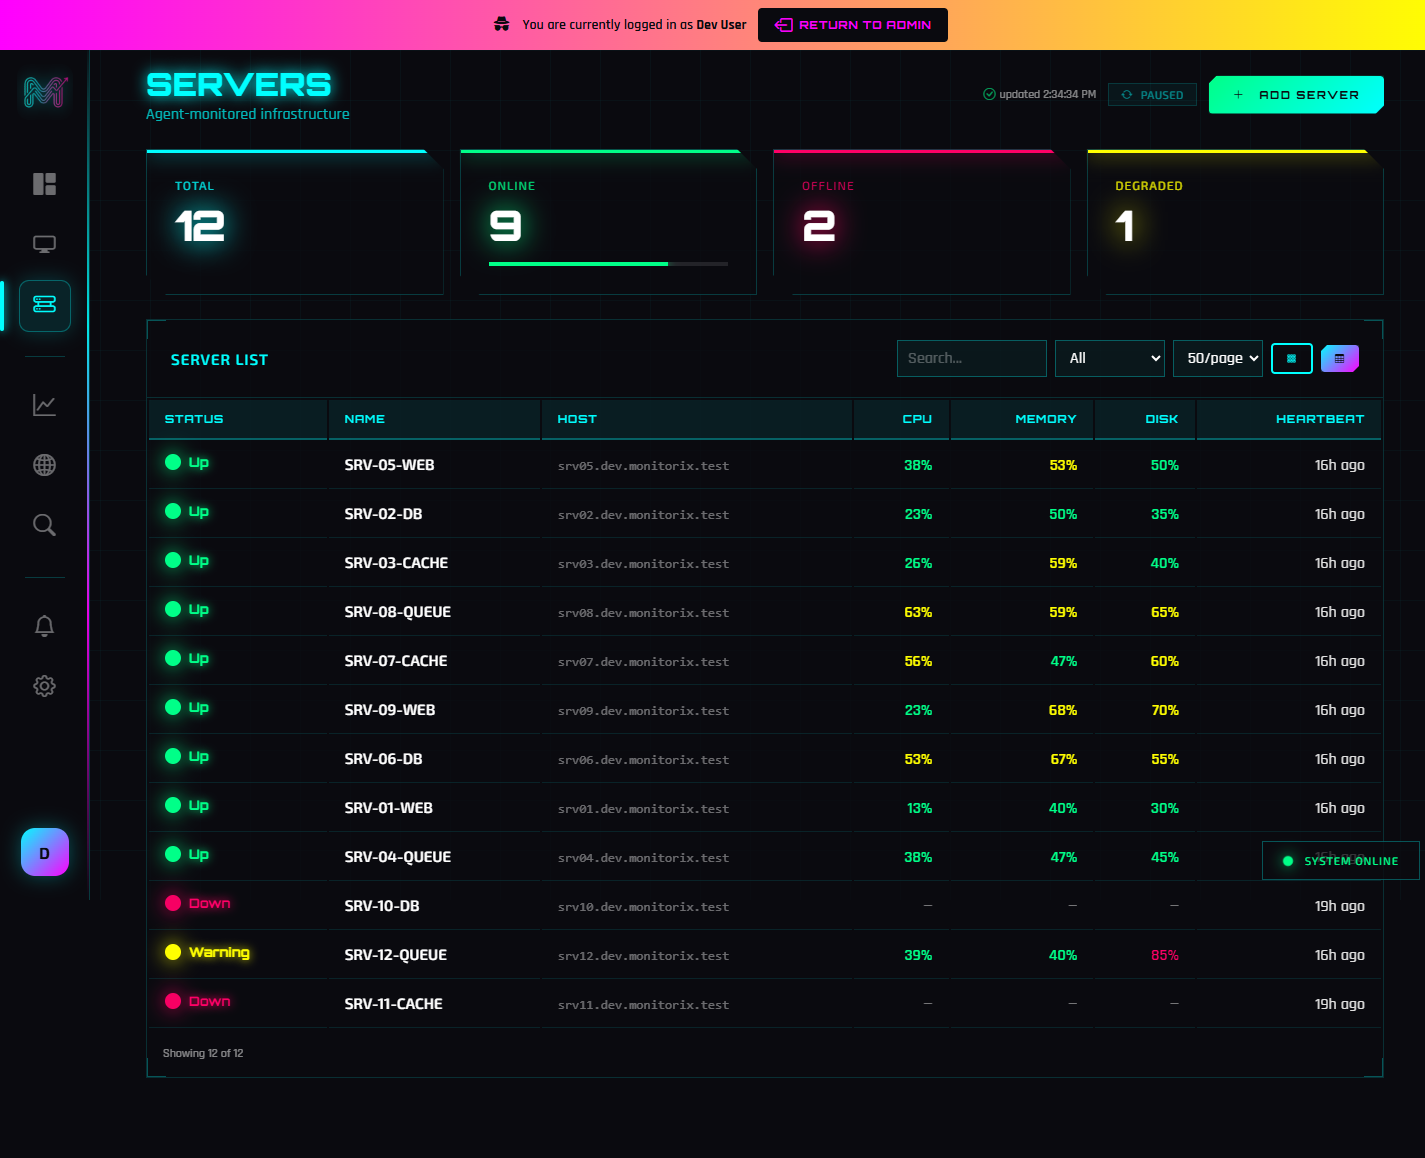
Once the agent is installed, Monitorix collects a full picture of each server's health every cycle:
- CPU — usage percentage and load average (1, 5, and 15 minute).
- Memory — used, free, and cached RAM, plus swap usage.
- Disk — usage percentage, free space, and read/write I/O.
- Network — inbound and outbound traffic and active connection counts.
- Processes — total and currently-running process counts.
Each server has its own detail page with live charts, so you can watch a trend develop over the last hour or dig into history.
How do resource alerts work?
You set thresholds for CPU, memory, and disk. When a server crosses a threshold, Monitorix alerts you — but only when the condition is sustained, not on a single momentary spike. A backup job that briefly pins the CPU won't page you; a server that's genuinely out of memory will. Alerts also have a cooldown so you get one clear warning, not a flood, and a follow-up when the resource recovers.
Why not just watch uptime?
Because most outages are preventable if you catch the cause early. A disk filling up, a runaway process, or memory exhaustion gives you warning signs hours before it crashes a service. Resource monitoring turns those signs into an alert while you still have time to act — which is the difference between a quiet fix and a 2 a.m. incident.
Does the agent slow my server down?
No. The agent is intentionally lightweight: it samples standard system counters, reports them, and stays out of the way. It only does heavier work — like a full service inventory — occasionally, and it samples the services you actually chose to monitor the rest of the time.
Getting started
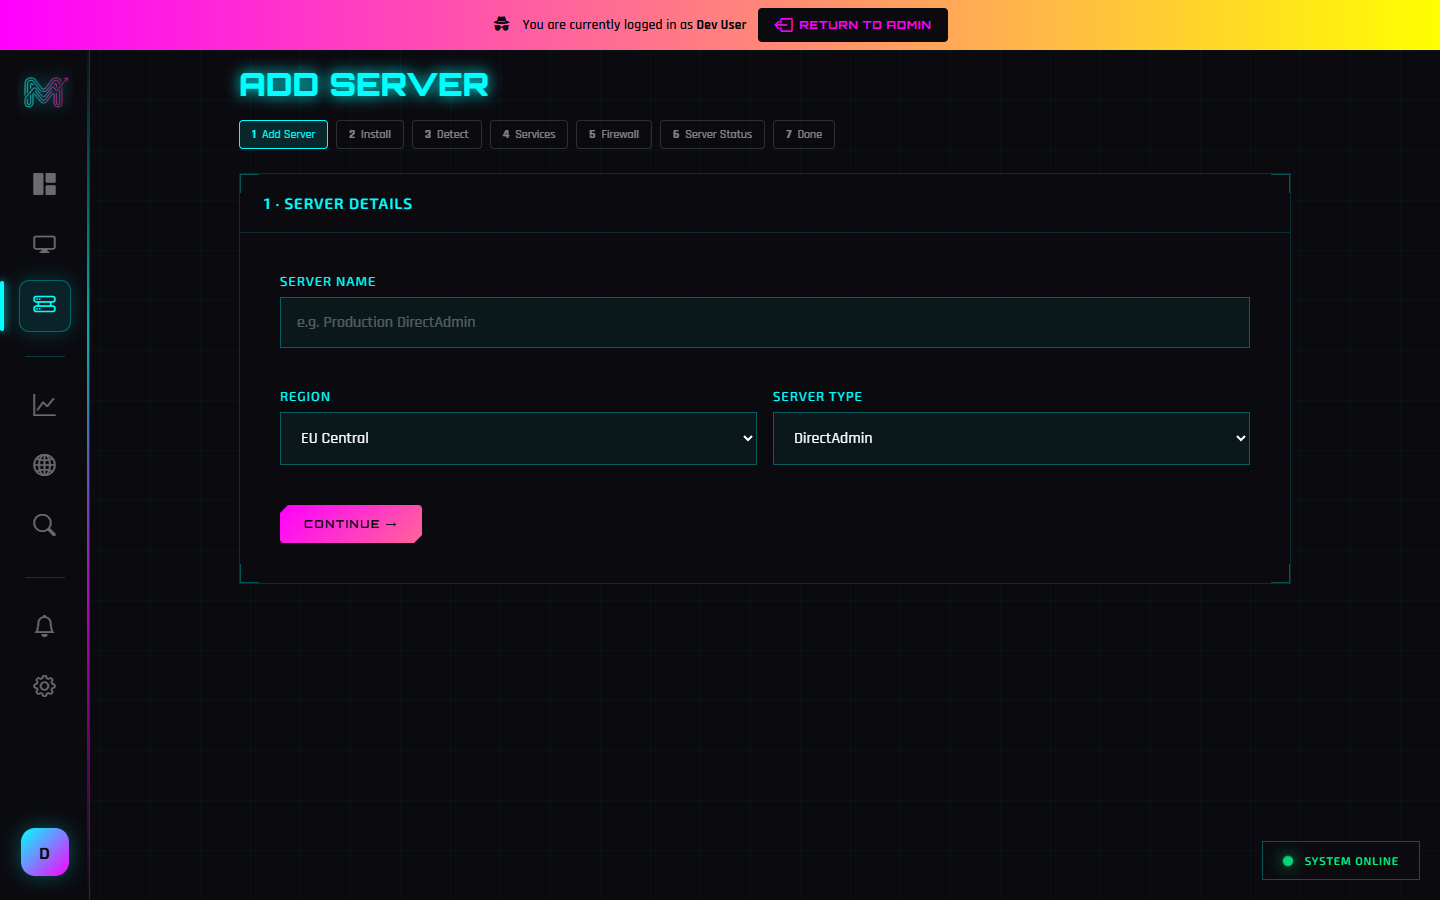
Install the agent using the guided setup, set thresholds that make sense for each machine, and connect your alert channels. From there, Monitorix watches the internals of every server so you don't have to.
Frequently Asked Questions
What server resources does Monitorix track?
When does Monitorix send a resource alert?
Does the monitoring agent slow down my server?
Why monitor server resources and not just uptime?
Related Posts